- Posts: 81
- Karma: 5
- Thank you received: 26
Graphing with curved lines
8 years 11 months ago - 8 years 11 months ago #1371
by NightOne
Graphing with curved lines was created by NightOne
Hi all,
I though I would give something back as this forum has been a great source of help to me getting things setup.
This is not meant to offend the developer of EasyIoT but I found that the graph was a little to stepped or jagged for me, as I measure Temp and Humidity I know that the change in temp and humidity is analog so should be gradual over time.
I also have to state upfront I am not a developer at all and this is just a hobby for me and I like to tinker with stuff so any code included most certainly can be improved on.
I discovered that there are plugins to flot which is being used to graph, there is one plugin from curvedlines.michaelzinsmaier.de/ called Curved that can be added to the js folder to make the graphs curved.
You can download the zip file from github and then all you need to do is add curvedLines.js to the js folder and include it in the index.html, meaning edit the index.html file and add the following at the top where all the other js scripts are added.
<script src="/js/curvedLines.js"></script>
save the file.
Then edit the Ha.WebApp.Control.js file and look for Ha.WebApp.Control.ChartDisplayData function on about line 1019
then you will see that the flot chart adds options.
Just add the following to the options
curvedLines: {
active: true,
apply: true,
},
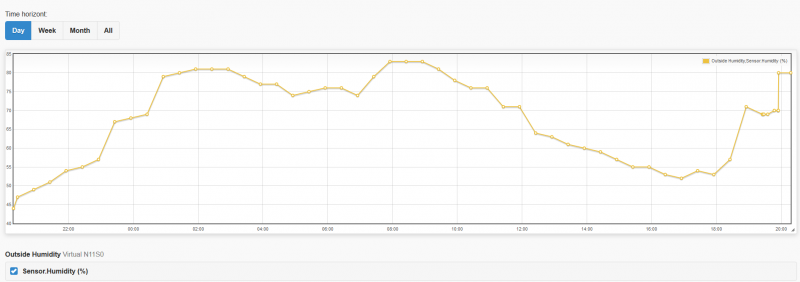
I have attached a picture to the post to show what the graph looks like with curved lines
Hope this helps at least one person")
I though I would give something back as this forum has been a great source of help to me getting things setup.
This is not meant to offend the developer of EasyIoT but I found that the graph was a little to stepped or jagged for me, as I measure Temp and Humidity I know that the change in temp and humidity is analog so should be gradual over time.
I also have to state upfront I am not a developer at all and this is just a hobby for me and I like to tinker with stuff so any code included most certainly can be improved on.
I discovered that there are plugins to flot which is being used to graph, there is one plugin from curvedlines.michaelzinsmaier.de/ called Curved that can be added to the js folder to make the graphs curved.
You can download the zip file from github and then all you need to do is add curvedLines.js to the js folder and include it in the index.html, meaning edit the index.html file and add the following at the top where all the other js scripts are added.
<script src="/js/curvedLines.js"></script>
save the file.
Then edit the Ha.WebApp.Control.js file and look for Ha.WebApp.Control.ChartDisplayData function on about line 1019
then you will see that the flot chart adds options.
Just add the following to the options
curvedLines: {
active: true,
apply: true,
},
I have attached a picture to the post to show what the graph looks like with curved lines
Hope this helps at least one person
Last edit: 8 years 11 months ago by NightOne.
The following user(s) said Thank You: Christian
Please Log in or Create an account to join the conversation.
8 years 11 months ago #1373
by NightOne
Replied by NightOne on topic Graphing with curved lines
UPDATE:
This may or may not be because I am stupid and I hope someone can tell me why.... I noticed that I was still getting jagged edges on some graphs... so I opened the curvedLines.js file and change the following options from false to true.
curvedLines : {
active : true,
apply : true,
I thought that these settings where the default and the changes that I made in the Ha.WebApp.Control.js file would overwrite them?
Well apparently not....as I said I am not a coder at all.
Now that I have change the defaults in curvedLines.js the curved lines now works properly.
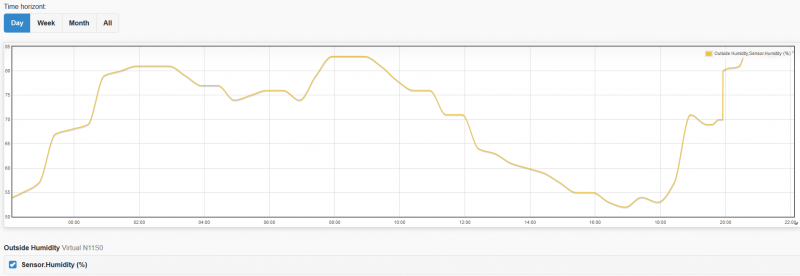
Please Log in or Create an account to join the conversation.
8 years 11 months ago #1391
by EasyIoT
Replied by EasyIoT on topic Graphing with curved lines
Thank you for code. But the problem lays elsewhere. You have digital and analog values in chart. For example door/window signal is digital and I want to be displayed that way - as discrete values not interpolated. We of course do not want this for analog signals. Problem is, that I do not know how to display discrete values and analog values on the same graph. So I decided all values are discrete. I you know solution how to mix both let me know and I will implement solution in EasyIoT server.
Please Log in or Create an account to join the conversation.
8 years 11 months ago #1480
by EasyIoT
Replied by EasyIoT on topic Graphing with curved lines
I found solution to display analog and digital values on the same graph. It will be included in next release.
Please Log in or Create an account to join the conversation.
8 years 11 months ago #1485
by asm7100
//
Allan
Replied by asm7100 on topic Graphing with curved lines
Coutten digi values just be showing like in a log??
//
Allan
Please Log in or Create an account to join the conversation.
8 years 11 months ago #1486
by NightOne
Replied by NightOne on topic Graphing with curved lines
Great work.... Thanks for the help
Please Log in or Create an account to join the conversation.
Time to create page: 0.490 seconds
Forum latest
- No posts to display.