- Posts: 9
- Thank you received: 0
Help with graphs
8 years 4 months ago - 8 years 4 months ago #2597
by anarro
Help with graphs was created by anarro
Hi,
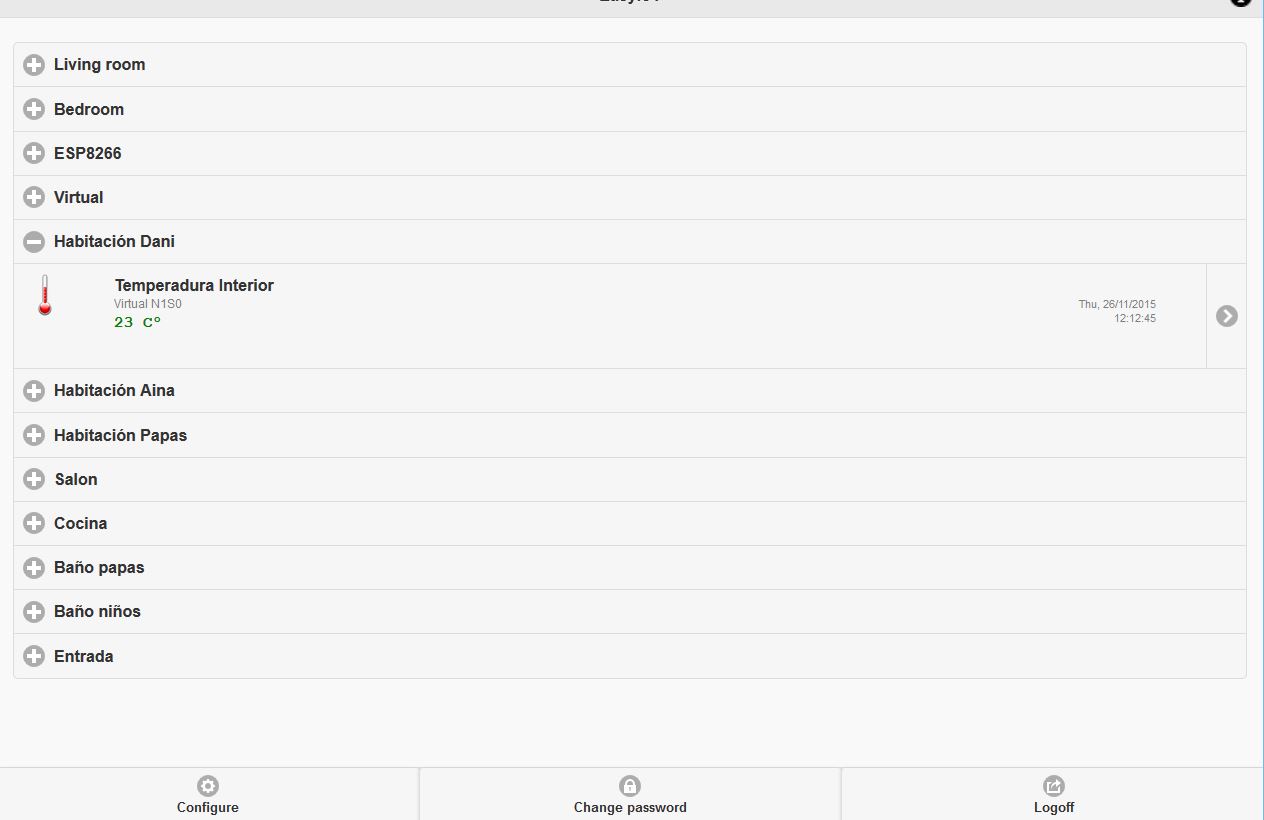
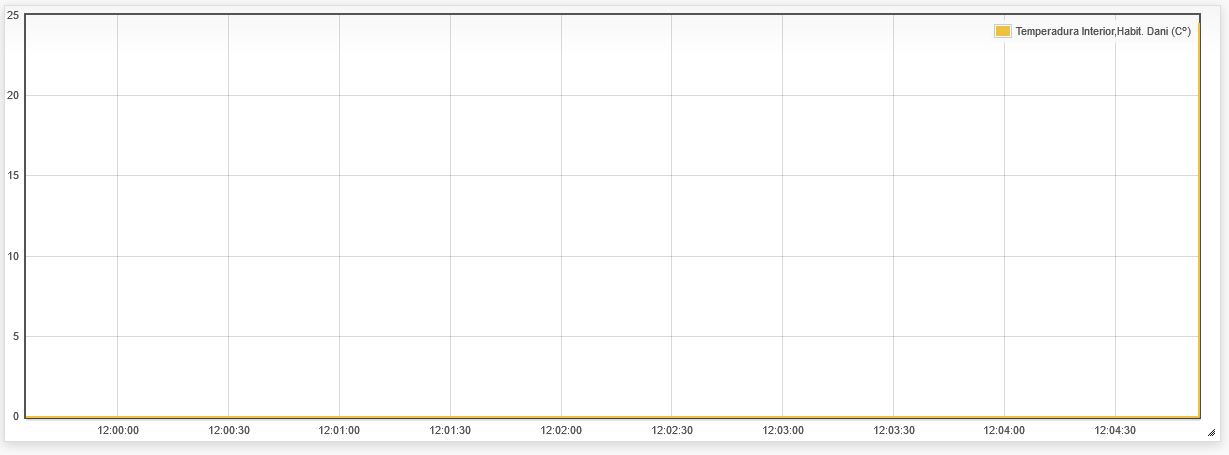
I can not get the graphics are shown always comes zero, the sensor if it works and shows me the temperature correctly, I am doing wrong?, someone can help me?
I use EasyIot server V0.9b1, I tried to remove and recreate the sensor and makes me the same..
Thank you!
I can not get the graphics are shown always comes zero, the sensor if it works and shows me the temperature correctly, I am doing wrong?, someone can help me?
I use EasyIot server V0.9b1, I tried to remove and recreate the sensor and makes me the same..
Thank you!
Last edit: 8 years 4 months ago by anarro.
Please Log in or Create an account to join the conversation.
8 years 4 months ago - 8 years 4 months ago #2598
by piman
Replied by piman on topic Help with graphs
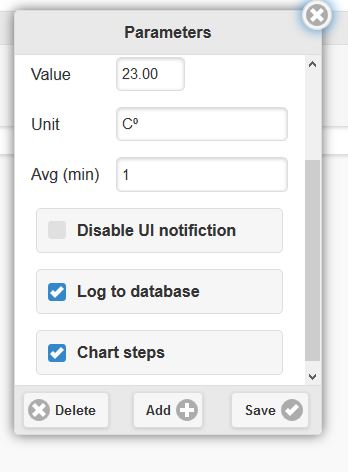
Try deselecting chart steps , and save .
Last edit: 8 years 4 months ago by piman.
Please Log in or Create an account to join the conversation.
8 years 4 months ago - 8 years 4 months ago #2600
by anarro
Replied by anarro on topic Help with graphs
Thanks Piman, now the graphs always show this:
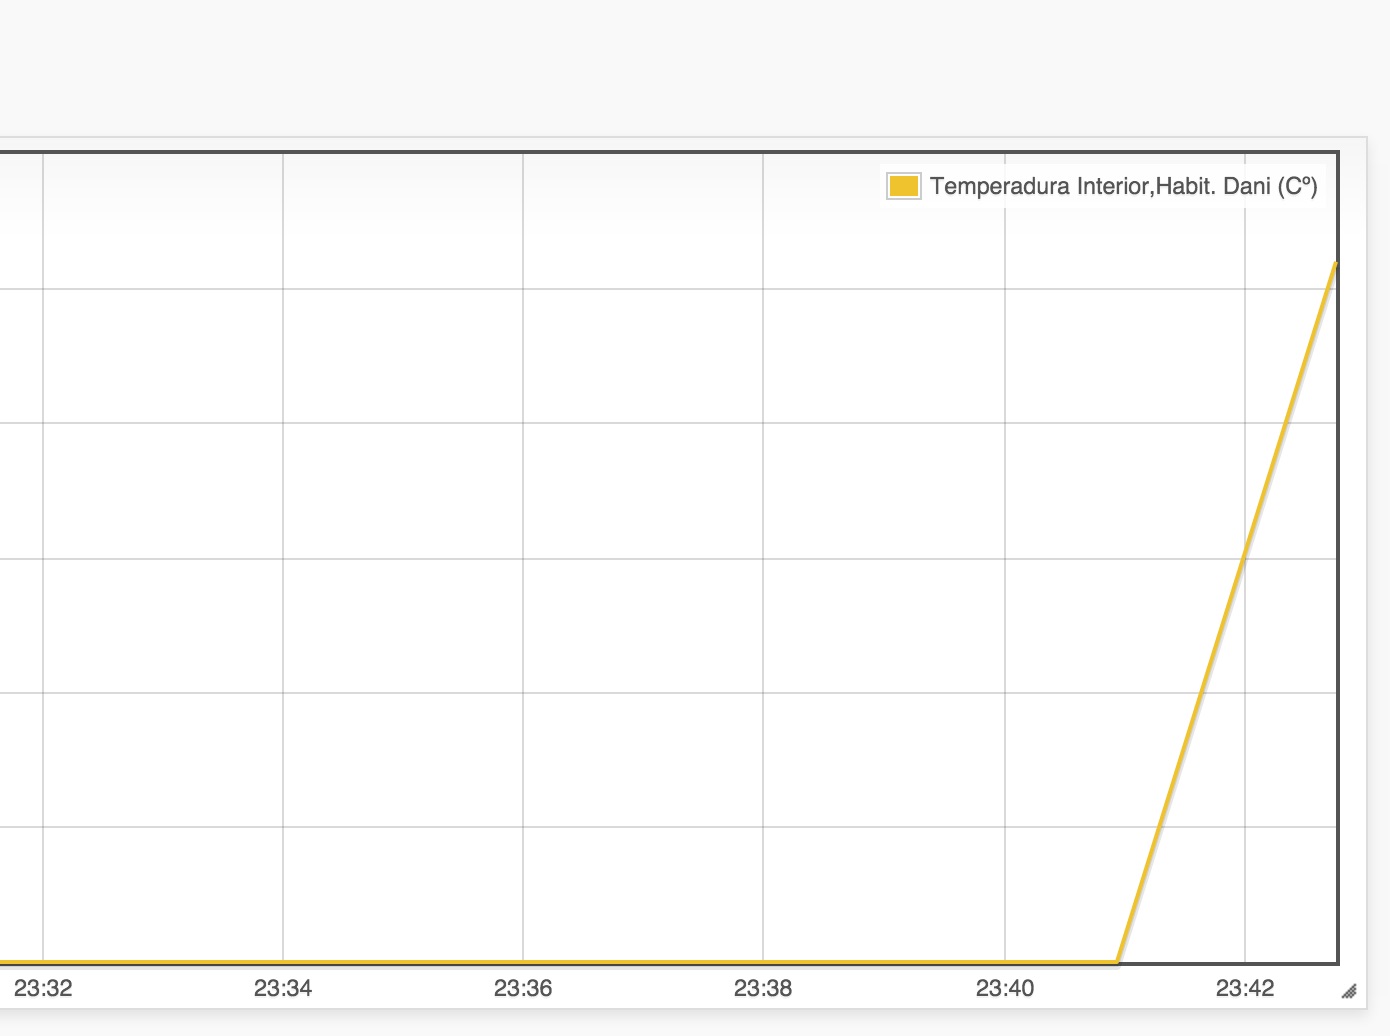
and I change it at 20:00 more o less...
and I change it at 20:00 more o less...
Last edit: 8 years 4 months ago by anarro.
Please Log in or Create an account to join the conversation.
7 years 9 months ago #3373
by neofox2k
Replied by neofox2k on topic Help with graphs
Have you resolved your problem yet? I have also problem with charts?
I cant see steps in Sensor.DoorWindow, the value it's always 0. I tried cleanning de data base but nothing happens.
Thanks
I cant see steps in Sensor.DoorWindow, the value it's always 0. I tried cleanning de data base but nothing happens.
Thanks
Please Log in or Create an account to join the conversation.
7 years 9 months ago #3375
by anarro
Replied by anarro on topic Help with graphs
Not resolved, sorry.
Please Log in or Create an account to join the conversation.
Time to create page: 0.548 seconds
Forum latest
- No posts to display.